Covid-19 Antibody Test Visualization
Lateral flow assay performance
I was responsible for the design and the majority of the project's implementation.
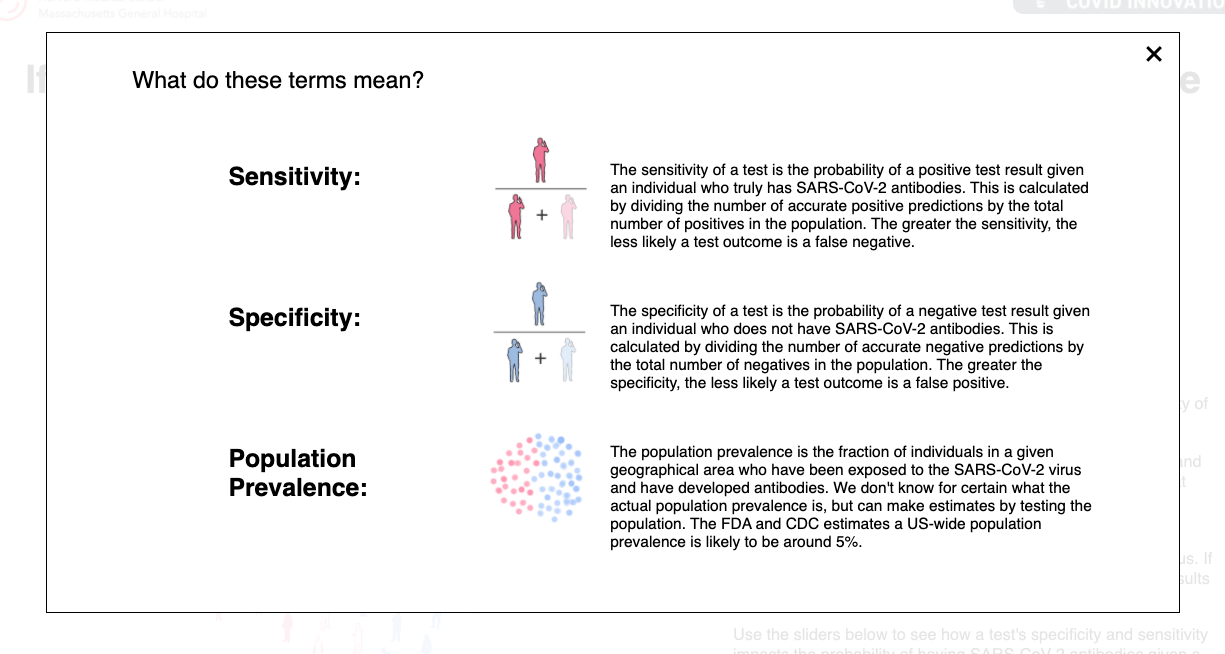
One of the goals set forth by the MGB Center for Covid Innovation is the evaluation of SARS-CoV-2 antibody tests. Blood samples of individuals confirmed to have Covid-19 combined with pre-pandemic Covid-19 negative blood samples are being used to evaluate the true specificity and sensitivity of lateral flow assays (LFAs) that have been released on the market.
The population-level performance of these lateral flow assays is essential when considering tests for back-to-work screening. However, the actual number of individuals exposed to SARS-CoV-2 in the US is unknown. Therefore, we designed an interactive visualization to explore how a dynamic population prevalence affects the likelihood of someone having antibodies given a positive result, using bayesian probability. Users can load the performance metrics determined by our lab for over 20 different LFAs, load the most up to date state and county level Covid-19 prevalences across the United States, and experiment with scenarios of their own using sliders.
The accompanying publication is available here.
K
r
W
X
B